

3 JSI indicators are built into ATAS — proof of official partnership and trusted quality.

Unique author-built solutions for ATAS, designed for advanced order flow analysis.

Adopted by retail and prop traders worldwide for consistent edge in markets.

1 Month Subscription (Full Pack, 9 Indicators): € 71
Want to test the indicators with an upgrade option?
Upgrade to Lifetime within your first month only, and we’ll subtract your monthly fee from the Lifetime price — just let us know!
Lifetime Access to any 1 Indicator from the Pack: € 99
12 Months Subscription (Full Pack, 9 Indicators): € 371 (481€ savings, € 30.1/month)
Lifetime Access (Full Pack, 9 Indicators):
919€
600€
(319€ savings, Unlimited access with a one-time payment)

Chart patterns are essential in technical analysis for spotting potential market movements. This indicator adds value by integrating volume-based filtering with pattern identification, allowing traders to analyze price action with more context. With over 14 customizable settings, traders can tailor the tool to match their specific trading strategies.
These features provide flexibility for traders to adapt their pattern analysis approach to their market strategy.
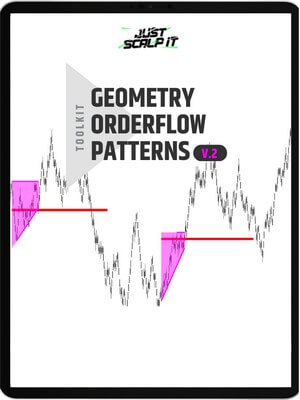
The Geometry Chart Patterns Indicator focuses on key patterns such as triangles. With integrated volume filtering, traders can focus on those patterns that occur alongside significant volume, offering insights into potential market strength or weakness.
Geometric patterns like triangles and expanding triangles are commonly used to detect breakout points. The indicator helps visualize these patterns directly on your charts, while the volume filtering provides a deeper analysis of the underlying market activity.
The Geometry Chart Patterns Indicator is a versatile tool that enhances technical analysis with the combination of pattern recognition and volume analytics. Its customizable settings and ability to integrate with volume-based data make it a valuable addition to trader’s toolkit.
Start using the Geometry Chart Patterns Indicator for ATAS today and explore its advanced features for deeper market insights.
 !
!