Risk warning
ATTENTION: The developer is not a certified financial advisor and is not registered to provide financial advice. By using the developer's products, you acknowledge and accept the following terms:
Disclaimer: The use of trading indicators does not guarantee profitability. Financial markets are volatile and subject to numerous factors that can influence trade outcomes.
Historical Data Dependence: Trading indicators are based on historical data analysis. However, past performance is not a reliable indicator of future results. Market conditions are dynamic, and historical trends and signals may not reflect current market realities.
Potential Repainting: The real-time visualization of trading indicators, particularly those based on order flow analysis, can differ from historical data due to market volatility and liquidity.
Risk of Capital Loss: Trading carries significant financial risks, including the potential loss of your entire investment. Indicators do not eliminate these risks, and traders should be prepared for such outcomes.
Educational Purpose Only: All products and materials provided, including indicators and strategies, are for educational and informational purposes only. They should not be construed as an invitation to buy or sell any financial instruments or make any investment decisions. Trading involves substantial risk and is not suitable for all investors. Risk capital is money that can be lost without affecting one's financial security or lifestyle. Only risk capital should be used for trading, and only individuals with sufficient risk capital should consider trading. The effectiveness of strategies and indicators may vary with market conditions.
Privacy Policy: We collect personal information such as name, contact information, and identification details. This information is used solely for providing various products and services. However, we cannot guarantee complete security of the information due to the inherent nature of the internet and other factors.
Disclaimer of Warranties: All software and indicators are provided "as is," without any warranties of any kind. We do not warrant that our software will meet your needs or be free from errors, or that its operation will be uninterrupted. The accuracy of the reports generated is not guaranteed.
Simulated Trading: Hypothetical or simulated performance results have inherent limitations. Unlike actual performance records, simulated results do not represent actual trading and are generally prepared with the benefit of hindsight. No representation is being made that any account will achieve profits or losses similar to those shown.
By using our products, you agree to these terms and understand the associated risks. It is recommended to thoroughly study and test indicators on historical data before using them in live trading.
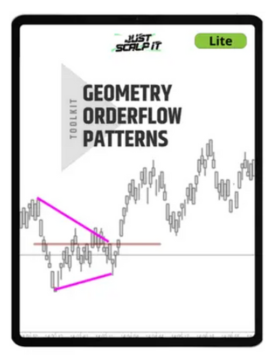
Geometry Patterns 2 Lite Indicator
The Geometry Patterns Lite Indicator identifies and displays triangle patterns on the chart, highlighting potential geometric formations.
Lite Version
• Detects Symmetrical Triangle patterns.
• Customizable triangle settings (strictness, color, opacity, width).
• Midline visualization (color, width, length).
• Alerts for detected patterns.
Full Version
• All Lite version features.
• Detects Ascending, Descending, and Expanding Triangles.
• Advanced order flow analysis with volume and delta filtering.
• Customizable POC and Max Delta line visualizations.
Learn more about the full version
The Geometry Patterns Lite Indicator identifies and displays triangle patterns on the chart, highlighting potential geometric formations.
The indicator offers settings to customize pattern recognition for different instruments and range-based timeframes. Adjusting these settings helps to ensure the indicator works based on the specific characteristics of the market you are analyzing.
Settings of the indicator

Use Triangle Pattern: Enables or disables the recognition of Symmetrical Triangle patterns.
Triangle Strictness: Controls the sensitivity of Symmetrical Triangle detection. Options are "Wide" (less strict, fewer points required) and "Moderate" (stricter, more points required).
Triangle Color: Specifies the color used to display the Symmetrical Triangle pattern lines.
Min Matching Candles in Next 10: Minimum number of candles matching the pattern direction within the next 10 candles after triangle (0 to disable, 1-10 to set.)
Triangle Fill Opacity: Sets the transparency level of the filled area within the Symmetrical Triangle, ranging from 0 (fully transparent) to 100 (fully opaque).
Triangle Width: Specifies the thickness of the lines used to draw the Symmetrical Triangle pattern, ranging from 1 to 10 pixels.
Show Midline: Enables or disables the display of a median line through the center of the Symmetrical Triangle.
Midline Color: Specifies the color used for the median line of the Symmetrical Triangle.
Midline Width: Sets the thickness of the median line, in pixels.
Midline Length: Specifies the extension length of the median line beyond the triangle's end, measured in bars, ranging from 1 to 100.
Use Alerts: Enables or disables alerts when a Symmetrical Triangle pattern is detected.
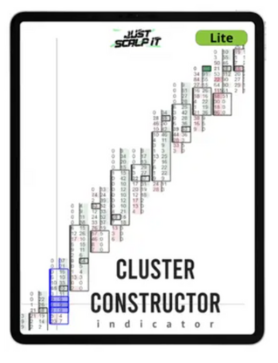
Cluster Constructor Lite Indicator
The Cluster Constructor Lite consists of the Double Max Volume Clusters Filter, which identifies and displays clusters with two maximum volume points within a single candle.
The Double Max Volume Clusters Filter detects key points of interest in the market by identifying areas where large trading volumes occur within individual candles. Unlike typical candles with a single maximum volume cluster, this filter highlights candles that contain two distinct maximum volume clusters, which may signal significant market movements or reaction levels.
In addition to identifying double max volume clusters, the Cluster Constructor Lite provides clear visualization of these clusters on the chart. This feature helps traders quickly pinpoint significant volume activity for timely analysis.
For a comprehensive approach, the Cluster Constructor Lite can be integrated with other indicators and tools to enhance overall market analysis.
Settings of the indicator
Search Double MaxVolume: Activation
Area: Specifies whether to search for these maximum volume clusters in all parts of the candle or only in the wicks.
Position: Determines the relative position of the clusters - whether to include all clusters, only those that are nearby, or only those that are apart from each other.
Use Alerts: Activates sound alerts when the indicator detects a signal.
Color: Allows you to choose the highlight color for the signal candle.
When using the Double Max Volume Clusters Filter, it is important to optimize and adjust the settings for minimum and maximum values based on the specific instrument you are trading.
Different instruments may require different configurations to accurately identify significant volume clusters within candles.
Experiment with various settings to find the most effective parameters for your trading style and the instrument you are analyzing.